Finance news
Finance news Highlights
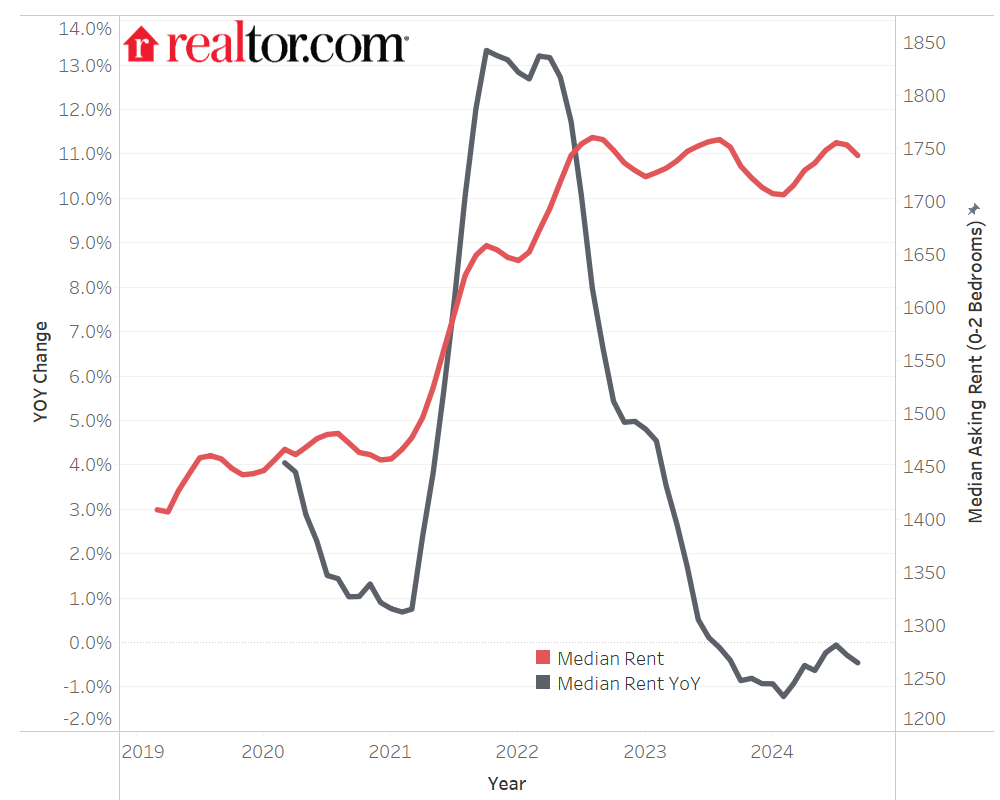
- September 2024 marks the fourteenth month of year-over-year rent decline in a row for 0-2 bedroom properties observed since trend data began in 2020. Asking rents dipped by $8 or -0.5% year-over-year.
- The median asking rent in the 50 largest metros registered at $1,743, down by $10 from last month and $17 lower than its August 2022 peak.
- Median rent declined in all size categories with larger declines in smaller-sized units: Studio: $1,442, down $34 (-2.3%) year-over-year; 1-bed: $1,623, down $8 (-0.5%) year-over-year; 2-bed: $1,930, down $8 (-0.4%) year-over-year.
- Cincinnati, OH topped the list of markets seeing the fastest year-over-year growth rate (3.4%), followed by Washington, DC (2.9%), New York, NY(2.8%), St. Louis, MO (2.6%) and San Jose, CA (2.6%).
- Nashville, TN experienced the largest year-over-year rent decline at -4.8%. Notably, among the top 10 markets with the most significant rent decreases, eight were located in the South.
In September 2024, the U.S. median rent continued to decline year-over-year for the fourteenth month in a row, down $8 or -0.5% year-over-year for 0-2 bedroom properties across the top 50 metros, faster than the rate of -0.3% seen in August 2024. The median asking rent was $1,743, down by $10 from last month, reflecting a similar seasonal trend as observed in the for-sale market.
Despite the fourteenth month of decline, the U.S. median rent was just $17 (-1.0%) less than the peak seen in August 2022. Notably, it was still $286 (19.6%) higher than the same time in 2019 (pre-pandemic), but this increase is roughly on par with what has occurred in overall consumer prices (up 22.7% in the 5 years ending September 2024) and pales in comparison to the 50.8% increase in median price-per-square-foot of for-sale home listings in the 5 years ending September 2024. Further, the relative steadiness in rents should translate into slower shelter inflation in the months ahead, alleviating one of the biggest recent drivers of rising prices.
Figure 1: Rents Decline Again, but Nationwide Rent Is Just 1.0% Below 2022 Peak
Finance news All units saw rent declines
In September 2024, the median asking rent for two bedroom units dropped -0.4%, a larger dip than the rate seen in August, and the sixteenth consecutive month of annual declines. The median rent for two bedrooms was $1,930 nationally, $31 (-1.6%) lower than the peak seen in August 2022. Nevertheless, larger unit rents had the highest growth rate over the past five years, up by $340 (21.4%).
The rent for one-bedroom units slipped -0.5% in September 2024 on a year-over-year basis, marking the sixteenth decline in a row and a slower pace compared to the decline of -0.7% in August. The median rent was $1,623, $35 (-2.1%) lower than the peak observed during August 2022, but still $247 (18.0%) higher than in September 2019.
In September 2024, the median asking rent for studios fell by -2.3%, marking the fourteenth consecutive month of annual declines. The median rent of studios was $1,442 in September, down by $48 (-3.2%) from its peak seen in October 2022. Nevertheless, the median asking rent for studios was still $162 (12.7%) higher than five years ago.
Figure 2: All Units Saw Waning Rent Declines
Table 1: National Rents by Unit Size
| Unit Size | Median Rent | Rent YoY | Rent Change – 5 years |
| Overall | $1,743 | -0.5% | 19.6% |
| Studio | $1,442 | -2.3% | 12.7% |
| 1-bed | $1,623 | -0.5% | 18.0% |
| 2-bed | $1,930 | -0.4% | 21.4% |
Finance news Markets experience fastest rent growth and declines
Table 2 highlights the top 10 markets with the fastest year-over-year growth in September 2024. Among these, one market is located in the Northeast, three in the South, three in the Midwest, and three in the West.
Table 2: Top 10 Markets with the Fastest Rent Growth in September 2024
| Metros | Median Asking Rents | Year-Over-Year Changes |
| Cincinnati, OH-KY-IN | $1,393 | 3.4% |
| Washington-Arlington-Alexandria, DC-VA-MD-WV | $2,293 | 2.9% |
| New York-Newark-Jersey City, NY-NJ-PA | $2,973 | 2.8% |
| St. Louis, MO-IL | $1,361 | 2.6% |
| San Jose-Sunnyvale-Santa Clara, CA | $3,377 | 2.6% |
| Louisville/Jefferson County, KY-IN | $1,287 | 2.5% |
| Sacramento-Roseville-Folsom, CA | $1,954 | 2.4% |
| Minneapolis-St. Paul-Bloomington, MN-WI | $1,555 | 1.9% |
| Oklahoma City, OK | $1,037 | 1.9% |
| Portland-Vancouver-Hillsboro, OR-WA | $1,737 | 1.9% |
Cincinnati, OH topped the list with a year-over-year growth rate of 3.4%. The other two Midwest markets on the list are St. Louis, MO (2.6%) and Minneapolis, MN (1.9%). In fact, 8 out of the 10 Midwestern markets saw rent growth in September 2024, whereas Chicago, IL (-2.6%) and Detroit, MI (-0.3%) were the only two with annual rent declines.
As Midwest markets tend to have greater affordability, it is not surprising to see stronger growth in these markets, which likely results from this benefit even as it may reduce existing affordability. In addition to the affordability, the relatively stronger labor market could also push up the rental prices. For example, in August 2024, the unemployment rate in St. Louis (3.9%) and Minneapolis (3.9%) were lower than the average unemployment rate across the top 50 metros (4.2%).
Washington, DC (2.9%), Louisville/Jefferson County, KY (2.5%), and Oklahoma City, OK (1.9%) are the three Southern markets with the fastest year-over-year growth in September 2024. Interestingly, Southern markets also dominated the list of those experiencing the largest annual rent declines. Nashville, TN (-4.8%) saw the steepest rent cooling in September 2024. In fact, eight of the top ten markets with the most significant declines are from the South, including Dallas, TX; Austin, TX; Birmingham, AL; Memphis, TN; Atlanta, GA; Miami, FL; and San Antonio, TX.
While the labor market in the South in areas such as Austin (3.7%) and Birmingham (3.1%) continues to outperform the top 50 average, with much lower unemployment, the rapid growth in new multi-family homes is putting downward pressure on rental prices and cooling the market.
Table 3: Top 10 Markets with the Fastest Rent Decline in September 2024
| Metros | Median Asking Rents | Year-Over-Year Changes |
| Nashville-Davidson–Murfreesboro–Franklin, TN | $1,578 | -4.8% |
| Dallas-Fort Worth-Arlington, TX | $1,475 | -4.0% |
| Denver-Aurora-Lakewood, CO | $1,889 | -4.0% |
| Austin-Round Rock-Georgetown, TX | $1,522 | -3.7% |
| Birmingham-Hoover, AL | $1,251 | -3.5% |
| Memphis, TN-MS-AR | $1,227 | -3.5% |
| San Diego-Chula Vista-Carlsbad, CA | $2,828 | -3.4% |
| Atlanta-Sandy Springs-Alpharetta, GA | $1,610 | -3.2% |
| Miami-Fort Lauderdale-Pompano Beach, FL | $2,372 | -3.1% |
| San Antonio-New Braunfels, TX | $1,268 | -3.1% |
Unfortunately, rapid year-over-year growth rates persist in some of the most expensive rental markets in the West and Northeast, such as San Jose, CA (2.6%), and New York, NY (2.8%). Despite weak labor market conditions, demand in these populous markets continues to outstrip limited rental supply, driving rents higher. Fortunately, renters in San Diego, CA, may begin to experience some relief, as the median asking rent has decreased by nearly $100 dollars or 3.4%, compared to the same time last year.
Finance news Appendix: Rental Data—50 Largest Metropolitan Areas—September 2024
| Metro | Median Asking Rent | YOY Change |
| Atlanta-Sandy Springs-Alpharetta, GA | $1,610 | -3.2% |
| Austin-Round Rock-Georgetown, TX | $1,522 | -3.7% |
| Baltimore-Columbia-Towson, MD | $1,831 | -0.6% |
| Birmingham-Hoover, AL | $1,251 | -3.5% |
| Boston-Cambridge-Newton, MA-NH | $2,975 | -0.8% |
| Buffalo-Cheektowaga, NY | NA | NA |
| Charlotte-Concord-Gastonia, NC-SC | $1,536 | -2.9% |
| Chicago-Naperville-Elgin, IL-IN-WI | $1,817 | -2.6% |
| Cincinnati, OH-KY-IN | $1,393 | 3.4% |
| Cleveland-Elyria, OH | $1,237 | 0.6% |
| Columbus, OH | $1,217 | 1.2% |
| Dallas-Fort Worth-Arlington, TX | $1,475 | -4.0% |
| Denver-Aurora-Lakewood, CO | $1,889 | -4.0% |
| Detroit-Warren-Dearborn, MI | $1,328 | -0.3% |
| Hartford-East Hartford-Middletown, CT | NA | NA |
| Houston-The Woodlands-Sugar Land, TX | $1,375 | -3.0% |
| Indianapolis-Carmel-Anderson, IN | $1,318 | 0.5% |
| Jacksonville, FL | $1,552 | -2.4% |
| Kansas City, MO-KS | $1,357 | 0.7% |
| Las Vegas-Henderson-Paradise, NV | $1,493 | -1.1% |
| Los Angeles-Long Beach-Anaheim, CA | $2,891 | 0.0% |
| Louisville/Jefferson County, KY-IN | $1,287 | 2.5% |
| Memphis, TN-MS-AR | $1,227 | -3.5% |
| Miami-Fort Lauderdale-Pompano Beach, FL | $2,372 | -3.1% |
| Milwaukee-Waukesha, WI | $1,675 | 1.6% |
| Minneapolis-St. Paul-Bloomington, MN-WI | $1,555 | 1.9% |
| Nashville-Davidson–Murfreesboro–Franklin, TN | $1,578 | -4.8% |
| New Orleans-Metairie, LA | NA | NA |
| New York-Newark-Jersey City, NY-NJ-PA | $2,973 | 2.8% |
| Oklahoma City, OK | $1,037 | 1.9% |
| Orlando-Kissimmee-Sanford, FL | $1,714 | -0.8% |
| Philadelphia-Camden-Wilmington, PA-NJ-DE-MD | $1,808 | -0.2% |
| Phoenix-Mesa-Chandler, AZ | $1,544 | -3.0% |
| Pittsburgh, PA | $1,480 | 1.1% |
| Portland-Vancouver-Hillsboro, OR-WA | $1,737 | 1.9% |
| Providence-Warwick, RI-MA | NA | NA |
| Raleigh-Cary, NC | $1,557 | -0.3% |
| Richmond, VA | $1,512 | -0.6% |
| Riverside-San Bernardino-Ontario, CA | $2,139 | -1.2% |
| Rochester, NY | NA | NA |
| Sacramento-Roseville-Folsom, CA | $1,954 | 2.4% |
| San Antonio-New Braunfels, TX | $1,268 | -3.1% |
| San Diego-Chula Vista-Carlsbad, CA | $2,828 | -3.4% |
| San Francisco-Oakland-Berkeley, CA | $2,808 | -3.1% |
| San Jose-Sunnyvale-Santa Clara, CA | $3,377 | 2.6% |
| Seattle-Tacoma-Bellevue, WA | $2,019 | -2.4% |
| St. Louis, MO-IL | $1,361 | 2.6% |
| Tampa-St. Petersburg-Clearwater, FL | $1,720 | -2.2% |
| Virginia Beach-Norfolk-Newport News, VA-NC | $1,544 | 0.1% |
| Washington-Arlington-Alexandria, DC-VA-MD-WV | $2,293 | 2.9% |


